Our friends at Football Study Hall do a great job with advanced statistics and I just wanted to share some of the Buckeye related statistics that the guys over there have found. Today we will be looking at last year’s ball carriers (anyone who carried the ball last year) and see how many yards they gained after the line “did their job.” These are the type of plays that separate a great ball carrier from a good one.
This is going to look and sound like a new language so here are some definitions:
Highlight Yards:Â The portion of a given run that is credit only to the running back; after a certain number of yards, the line has done its job, and most of the rest of the run will be determined by the running back himself. For more information, start here. An important note, however: a player’s per-carry highlight yardage is now calculated as follows: Highlight Yards divided by Opportunities. In this case, Opportunities mean only the carries in which the offensive line “did its job,” i.e. carries that went at least five yards. With a different denominator, then, it is possible for a player’s Highlight Yards per carry to be much higher than his overall yards per carry.
Block Success Rate: Highlight Opportunities divided by total rushes. Basically, how many times did the offensive line get the ball carrier to the second level (five yards).
Adj. POE:Â POE stands for “Points Over Expected.” The idea for POE is simple: It compares a runner’s production to the production that would have been expected of an average back given the same carries against the same opponents. A runner with, say, a plus-6.0 Adj. POE produced the equivalent of a touchdown more value than the average FBS running back would have with the same carries.For more information on Adj. POE, start here.
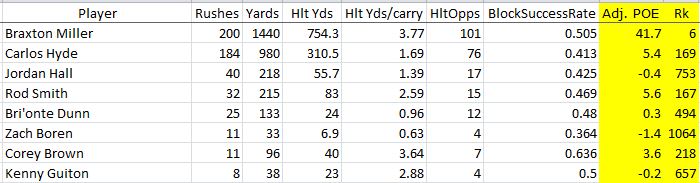
Using the above definitions, lets see how the Buckeye ball carriers performed last season. The far column on the right “Rk” takes all of the ball carriers in the nation (roughly 1,500 players) and ranks them versus each other based on Adj. POE. Overall, we are looking at how effective the ball carrier is after the first 5 yards. It’s the difference between a negative to 5 yard gain and a back breaking play in a big game.
 A few things stand out here…
- Braxton Miller gains a ton of highlight yards and he is also helped by his offensive line (%50 block success rate). He mostly runs outside of the tackles, but without good blocking by the wide receivers and the line’s ability to get him past the first 5 yards he does not have a chance to make plays in the open field. Miller is using his offensive line to gain positive yardage, then he is making defensive backs miss in the open field. It sounds obvious but it takes a special talent like Miller to make the best athletes on the defensive side of the ball look foolish in the secondary.
- He was playing through injury last year but I expected Jordan Hall to have a higher Adj. POE. He never got into a good rhythm after missing the preseason and I do expect him to be better next year in the open field, using his speed and his new position.
- I thought Carlos Hyde would have lower highlight yardage due to his “power back” persona. Not only is Hyde gaining the tough yards but he is also doing a good job gaining those extra yards once he gets to the second level.
- We saw a few glimpses of Rod Smith last year and the statistics show he should get some more carries this season. If Hall or Hyde go down, Smith has shown big play capabilities and he could flourish in Meyer’s offense.

Great post, Chris. It’s crazy to think that Braxton was #6 on the POE rankings but not surprising. I’d expect to see him right up there again in 2013.
So if I understand this correctly, Hyde’s numbers are even more impressive because he was only getting “good” blocking 41% of the time. That’s making something out of nothing.
(I’d love to see Beanie’s numbers in 07 and 08. I’d assume that OL’s success rate was in the basement)
Yes exactly. They only have data from the 2011 and 2012 seasons, I can only imagine how many hours they put into finding these statistics