 How many of you knew that it was Illinois, and not Michigan, that used to be OSU’s primary rival? The annual matchup with Michigan didn’t really become a full-blown rivalry until WWII. Prior to that era, however, the Buckeyes and the Illini were among the fiercest rivals in college football. They met on the last game of the season until 1933, and have been on each other’s schedule every year but two (2003 and 2004).
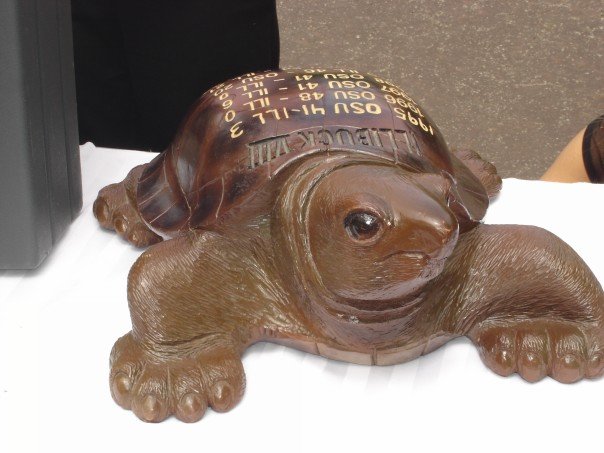
To this day the teams pass back and forth the “Illibuck,” the second-oldest trophy in the league. They originally passed back and forth a real turtle, but its death in 1927 caused them to modify the tradition. Since then, nine wooden replicas of the original Illibuck turtle have been carved, each with the scores of the games on its back. Yes, Illy Illibuck even has a Facebook page.
Bonus tradition goodness: Honor societies from both schools used to ritualistically share a “special” peace pipe at halftime. I assume the tradition stopped due to the lack of twinkies and BBQ potato chips in the vending machines at the ‘Shoe.
The tables list the opponent(s) in chronological order down the first column, and include the following ‘important’ stats: total points (Pts), total yards (Yds), total first downs (Dwns), and turnovers (TOs); for each team and its opponent (Opp).
Table 1: Illinois
| Pts | Pts (opp) | Yds | Yds (opp) | Frst Dwns | Dwns (opp) | TOs | TOs (opp) | |
| Penn State | 27 | 20 | 336 | 427 | 17 | 18 | 2 | 4 |
| Wisconsin | 31 | 26 | 410 | 519 | 18 | 28 | 0 | 2 |
| Minnesota | 44 | 17 | 655 | 337 | 27 | 18 | 2 | 1 | TOTAL | 102 | 63 | 1401 | 1283 | 62 | 64 | 4 | 7 |
| AVERAGE | 34 | 21 | 467 | 427.7 | 20.1 | 21.3 | 1.3 | 2.3 |
Table 2: Ohio State
| Pts | Pts (opp) | Yds | Yds (opp) | Frst Dwns | Dwns (opp) | TOs | TOs (opp) | |
| Minnesota | 30 | 7 | 459 | 277 | 24 | 15 | 1 | 2 |
| Penn State | 37 | 17 | 453 | 263 | 24 | 14 | 1 | 2 |
| Wisconsin | 38 | 17 | 377 | 281 | 21 | 15 | 0 | 2 |
| TOTAL | 105 | 41 | 1289 | 821 | 69 | 44 | 2 | 6 |
| AVERAGE | 35 | 13.7 | 429.7 | 273.7 | 23 | 14.7 | 0.7 | 2 |
Oohh!! Oooh! Bonus table goodness this week!! The values in Table 3 indicate a team’s overall performance, percentage-wise, against the average numbers the common opponents typically allow.
For example, in the table below, Illinois scored an average of 24% more points on these common opponents than what those opponents typically allow, while the Illini defense held these opponents to 27% fewer points than what they were typically used to, and so on.
Table 3: Performance against what Common Opponents Typically Allow
| % Scoring | % Scoring Defense | % Yards | % Yards Allowed | |
| Illinois | +24 | -27 | +15 | +6 |
| OSU | +26 | -52 | +8 | -32 |
Notes:
At first glance, it seems the teams perform similarly to one another. That’s if you skim the Average and Total rows in Tables 1 and 2. However, compare the games themselves. Look at how Illinois performed against Penn State (7 point differential) to how OSU performed against that same team (20 point differential). Wisconsin is very similar: the Illini won by less than a touchdown, where OSU beat the Badgers by three touchdowns. Moral: the Illini’s performance against hapless Minnesota seems to be skewing its averages.
Also notice the scoring trends. (It’s why we list the teams chronologically.) Both teams’ offenses are scoring more points each game. FWIW.
Check out the Yards Allowed column in Table 3. Illinois is actually allowing opponents 6% more yards than what they typically average. It hasn’t come back to bite them, though, as their offense has performed well enough to cover for the weakness.
Anything else jump out at you?

I was never aware of the rivalry between those two teams. Great analysis as well.